Search

Trip Database Blog

Liberating the literature

Month

October 2013

Uncertainties and search

Shops, they connect the producer to the consumer.

A supermarket contains a large number of products from a large number of producers.  Consumers come in and wander round picking off products off the shelves.  Problems arise in a number of ways, and one clear example is when a user can’t find the product.  The shopper’s need is unmet.  The shopper is dissatisfied.

In many ways Trip is a supermarket – a supermarket of evidence.  Consumers come to the site with a wide variety of needs and we do our best to match the consumer with the producer.  The consumers being doctors, nurses etc.  The producers are the likes of NICE, AHRQ, Cochrane, BMJ etc.

Problems arise in a number of ways, and one clear example is when a user can’t find the evidence. The health professional’s need is unmet.  The health professional is dissatisfied.

I can’t help feeling the likes of Tesco, Carrefour, Spar, Walmart etc really understand their consumers and try to understand their unmet needs/frustrations.  A few years ago a celebrity chef/cook mentioned a product (some sort of birds egg) which caused a huge increase in interest and large unmet need at the supermarkets.  Supermarkets realised they were missing market and desperately sought appropriate stock.

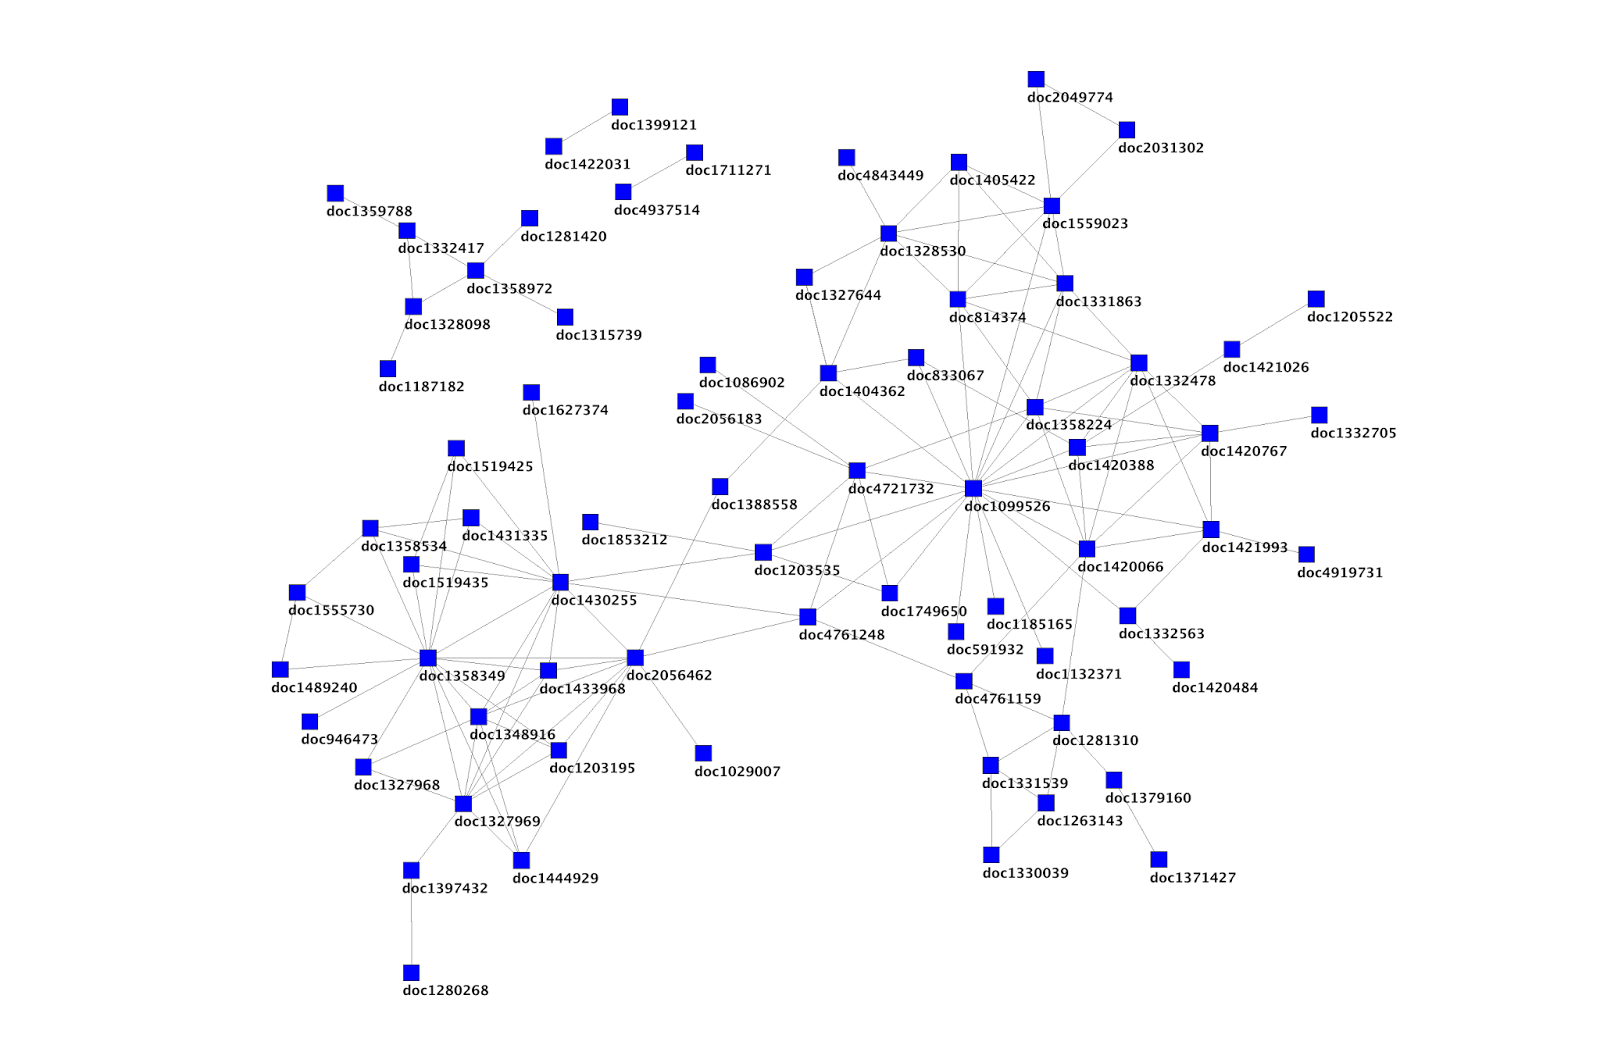
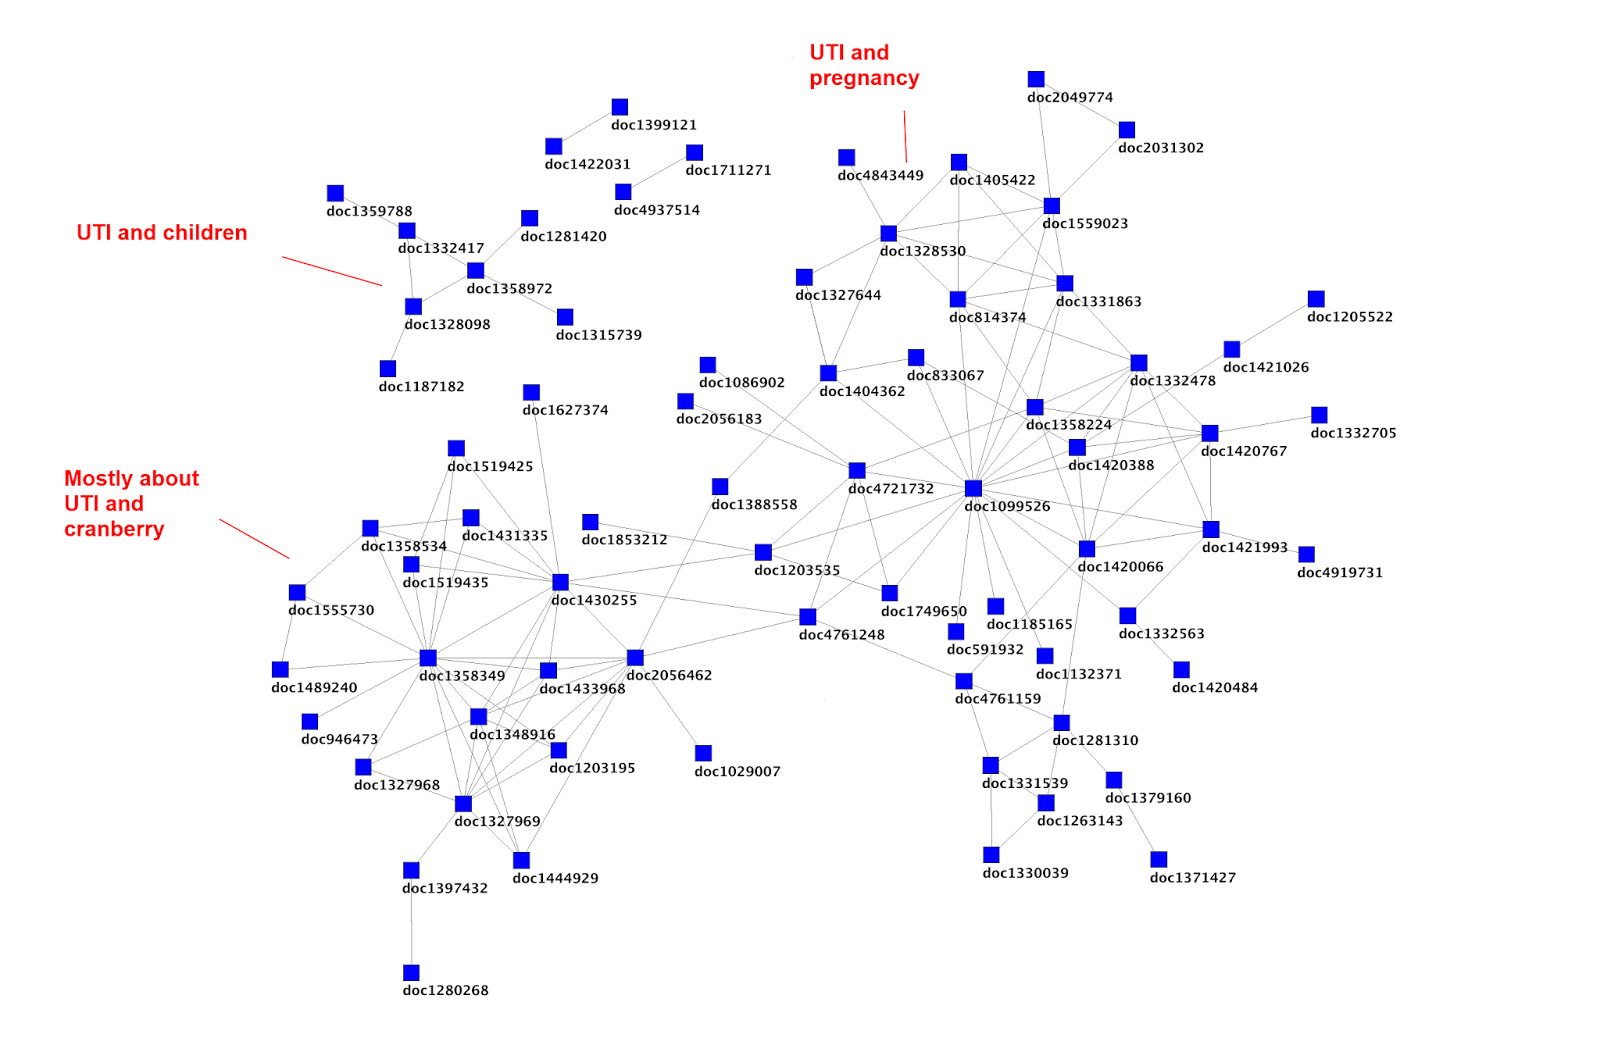
In Trip, we record most things a user does on the site.  It allows us to better understand the research landscape and draw information (and pretty) graphs such as seen here.  One thing we’re not good at is mining the data on dissatisfied users.  As ever time is a problem – there’s only one of me!  But I don’t think I’ve ever given it a great deal of thought.

Arguably a user coming to the site and searching and not clicking on an article is a clear sign that they have not had their information need met.  I wonder if it’s more sophisticated than that.  It might be that on average – for each search – 2 articles are clicked on.   Can we spot trends where for a given search term(s) lower than average articles are clicked on? 

This could have two effects:

  • Trip could try and locate producers of evidence in this area and bolster our index.
  • It might be that evidence has not been produced at all and therefore the challenge is down to the producers to help meet this un-met need.

Just a thought.

Structure in Trip (Social networks part two)

Last week I posted an article The social networks of articles.  In the ten days since then things have moved on with additional further analysis provided by Orgnet, LLC. As an aside look around the site, the case studies are brilliant!

We supplied the same data as last time, a sample of UTI searches (either alone or with additional terms) and what came back was stunning (amazing what you can do with the appropriate expertise and software – InFlow 3.1):

The image above reinforces my initial analysis that there is a rich structure within the data.  Each node is a unique article in Trip and the links are made from the clickstream data (see previous post)

But, does the structure have a meaning?  That required additional analysis, see annotated image below (click on image to expand):

I don’t think anyone can appreciate how exciting this was for me!  Even with a small sample of data we’re revealing a rich structure; a rich structure that has meaning. In effect, by using Trip, our users are curating the content, crowdsourcing the organisation of it.

I’ve had these images for a few days now and I’m still reflecting on the next steps.  In keeping with my Clinical Like Me idea I’d be really interested in seeing how networks compare by similar clinicians.  So, at a high level the network for UTI would likely be different if the search was from a general/family practitioner versus a urologist versus a paediatrician.  But loads of other potential applications from speeding up the review process, highlighting related articles etc.

The social networks of articles

Years ago I did a lot of work on social network analysis, but I then moved away from the area.  However, my interest got renewed when I read this article in PLOS ONE Clickstream Data Yields High-Resolution Maps of Science.

Clickstream data is the data a website records when a user comes to the site.  In the case of Trip a user would visit the site, conduct a search and then click on a number of articles.  Below is an example set of data:

0blzia55j3krmi55nuqc24nc    11/07/2013    Pregnancy UTI    5
0blzia55j3krmi55nuqc24nc    11/07/2013    Pregnancy UTI    6
0blzia55j3krmi55nuqc24nc    11/07/2013    Pregnancy UTI    7
0blzia55j3krmi55nuqc24nc    11/07/2013    Pregnancy UTI    8

The first column is the session id, second is the date, third is the search term used and the 4th is the unique document ID (this is typically a long number but I’ve transformed it for the sake of the analysis).  So, in the above example, a user search for pregnancy UTI and clicked on documents 5, 6, 7 and 8.

Big deal you may say!  Well, I think it is a big deal, I think it has the potentially to be really important.  And here’s why.  The user came to Trip with an intention and they have clicked on documents 5-8.  They have told us that, for their search intention, those documents are linked.  The ‘intention’ bit is vital as search is improved if we have more knowledge about the users intention.  In isolation this might be meaningless, but over thousands of users you get lots of really useful data.  Data that can be analysed. Below is an network map I produced (crudely as I’m not skilled in social network software packages). NOTE: for those eagle-eyed it’s not based on the same data as the example data given above.

Each number represent a unique article and the lines represent a relationship between them (a relationship is formed when a user clicks on the two articles in the same session).As you’ll see there is a structure, and where there is structure there is value.  I’m not talking financial value.

I was convinced that there would be a structure to the clickstream data, which is correct (as shown above) and I’m convinced that there is value in the structure.  That’s the next step, to understand it.  I’m got some help in analysing the key structural elements (of a sample of searches for UTI) and from there, who knows.  I’ll report back ASAP.

In the interim, from the same website as above (Orgnet) I highlight two articles for interest:

Trip Rapid Review worked example – SSRIs and the management of hot flashes

While doing some curation work on Trip I came across this paper “SSRIs for Hot Flashes: A Systematic Review and Meta-Analysis of Randomized Trials”, so I thought I would work through an example – to keep checking the system.

Step 1 – the search.  This was a bit fiddly!  I didn’t want to simply search for SSRI, so I added a few named SSRIs as well (citalopram, escitalopram, fluoxetine, paroxetine and sertraline).  I also wanted to search for hot flashes OR hot flushes.  A bit of mucking around with the syntax gave me the following:

(“hot flushes” or “hot flashes”) and (SSRIs or citalopram or escitalopram or fluoxetine or paroxetine or sertraline)

This returned 41 possible trials in Trip. 

Step 2 – the analysis. I then went through the titles and selected 13 articles which I felt matched the research question and pressed the ‘Analyse’ button which gave a score of +0.42 – this was after about 5 minutes (would have been quicker if I hadn’t messed up the search syntax).

Step 3 – checking.  Trying to improve the quality I went through the articles to check the various components (effect and sample size) and found I had to adjust three of them (mainly sample size) and this gave a new figure of +0.31.  NOTE: this step added an extra 3 minutes.

So, the final score is +0.31!

Now, time to check against the actual systematic review.  They only included 11 trials (so 2 less than we included – this raises an issue around the lack of quality assessment of our articles).  But, their conclusion:

“SSRI use is associated with modest improvement in the severity and frequency of hot flashes but can also be associated with the typical profile of SSRI adverse effects.”

So, both systems indicate that SSRIs are potentially useful in managing menopausal hot flushes/flashes.  So, on a broad level Trip Rapid Review got the same result as the systematic review.

One issue relating to harm to note, in the results they report “Adverse events did not differ from placebo” which is interesting as in the conclusion they report “…but can also be associated with the typical profile of SSRI adverse effects.”  Essentially, the systematic review didn’t find any particular harm issues, therefore I assume the authors are relying on external data.  I raise this as the Trip Rapid Review system is not – yet – trained to look for adverse events.  But, in this case, I imagine a user could look at any drug reference system (e.g. BNF) to highlight potential adverse events.  Being even more controversial they could even look at the adverse events list in Wikipedia.

So, same result using Trip Rapid Review in eight minutes, I shudder to think how long it took the seven authors of the systematic review – perhaps a year!?

So, what are the lessons learnt?  For me, the following:

We use minimal critical appraisal, our main effort (but the most important) is checking it’s a randomised trial or not.  In future we could easily adapt the system to alter scores based on them being appraised or not.  For instance, if the trial appears in Evidence Updates we assume it’s valid.

I still have issues of the number/final score.  We reported 0.31 but what does that mean?  I favour trying to assign various narratives based on the score, for instance:

  • 1 >> 0.5 = Intervention is highly likely to be beneficial.
  • 0.49 >> 0.25 = Intervention is likely to be beneficial.
  • 0.24 >> -0.24 = Evidence is weak or ambiguous.
  • -0.25 >> -0.49 = Intervention is unlikely to be beneficial.
  • -0.5 >> -1 =  Intervention is highly unlikely to be beneficial.

But these could be modified based on the number of trials.  For instance scores based on multiple trials is likely to be more reliable than those based on a few.

Trip Rapid Reviews is probably a lot more than interesting!

Remember Trip Rapid Reviews is free and really easy to use – why not try it for yourself?

Trip Rapid Reviews – systematic reviews in five minutes

Wow, a systematic review in five minutes, surely not.

Well, behind the hyperbole, we’re not actually claiming that.  What we’re saying is that we’ve created a system to rapidly ‘examine’ multiple controlled trials and to attempt to approximate the effectiveness of an intervention.

So, how does it work?  It’s surprisingly straightforward:

  1. You press the ‘Trip Rapid Review’ button and two search boxes appear, one is for the population (e.g. diabetes, acne) and the other is for the intervention (e.g. metformin, diet).  You enter the appropriate terms and press search. NOTE: The current system is optimised for placebo-controlled trials or trials versus ‘normal care’.
  2. The user is then presented with a list of controlled trials which correspond to the search terms and the user selects those they feel are appropriate and then press the ‘Analyse’ button.
  3. Our system then machine reads the abstracts and tries to understand if the article favours the intervention or not.  It also tries to ascertain the sample size.  It reads the article using two separate machine reading systems (decision tree and naive bayes) and if they both agree about the result we accept them but if they disagree we display the conclusion and ask that you manually tell us the result(s).  A positive trial scores +1, a negative trial scores -1.
  4. Once we have all the information we perform a simple adjustment (based on sample size) so that a small trial is reduced by 75% (so scoring +0.25 or -0.25) and if it’s medium the adjustment is 50% (+0.5 or -0.5).  Large trials are kept at +1 or -1.  
  5. All these scores are averaged out to give a figure, the overall score for the intervention.

In most situations this will take 5 minutes, but if a user locates lots of trials it’ll take a bit longer.

A really important message to get across is that our system has not been formally validated (although you may be interested in these in-house results)!  We have done lots of in-house testing (comparing our results with systematic reviews) but we’re committed to evaluating this approach, but until then use suitable caution.

One reason for releasing it – unvalidated – is to allow the Trip users to try it and see how they get on and if the results are plausible.  In most cases we think they will be, but we’re particularly interested in cases where our system fails – as these are the learning points for us.  So, if you try it, find it to not work – please let us know.

Another issue, relating to users trying it, is to try and understand what the numerical data means.  While an overall score of +1 indicates a really positive intervention and -1 a really negative, what does a score of 0.25, 0.35 or 0.45 indicate.  These are the things that require feedback to get right – so keep it coming.

We’re also hoping our approach will stimulate other people to improve on our system – to be inspired.  We already have plans for a version 2 with numerous improvements but we’d be delighted if other groups do even better – as long as they keep it free for others to use!!

But, the best way to understand the system is to try it for yourself, it’s free and really easy to use.  So, try it now and let me know how you get on!

Blog at WordPress.com.

Up ↑