At the start of the year I posted Ok, I admit it, I’m stuck, which was a cry for help from the Trip community to help me make sense of all our lovely clickstream data. We had a few responses and one was from an Australian research and management consultancy QSPectral, a company specialising in providing strategic insights and predictions through advanced data science and analytics. They have been working with us to help us make sense of our clickstream data.
Article Association
QSPectral used their data science expertise to investigate the connections between the articles based on the user access data contained within the Trip Database.
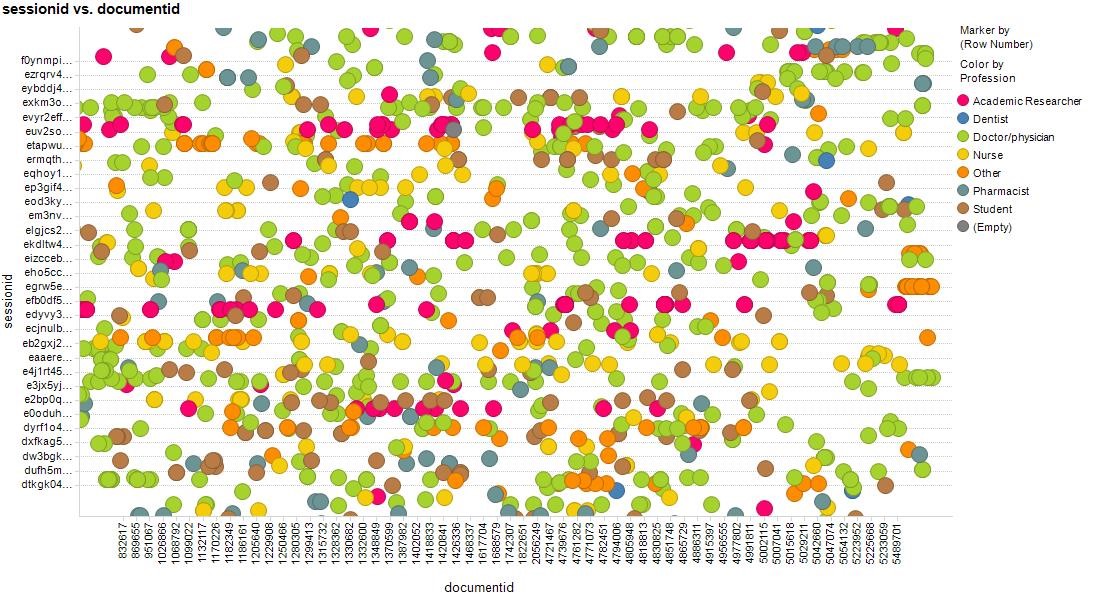
Figure 1 Snapshot of articles accessed across a session. The colours represent user professions (doctor, nurse, etc.)
In the above image the Y-axis represents individual search sessions and the X-axis is the documentID (each article in Trip has a unique document ID). So, we can see what professions are looking at which articles. We can actually see what articles individuals are looking at, but the above image shows it on a profession basis.
Figure 2 A more focused snapshot of the previous image
As a user do you want to see what other articles are similar to the one you are reading?
Do you want to know what others like you thought were similar?
To provide answers to these questions, QSPectral developed an algorithm based on association rules to explore the relationships between articles on a per session basis. We intended to identify links between articles based on different criteria of interest.
The strength of the links was measured by statistical measures such as confidence and support factors. These led to association rules, which were of the form if {article x is accessed then articles y and z} were also accessed were further enhanced by including additional user characteristics – information such as the profession (nurse, doctor..) as well as country of origin were used to moderate the previously established article relationships.
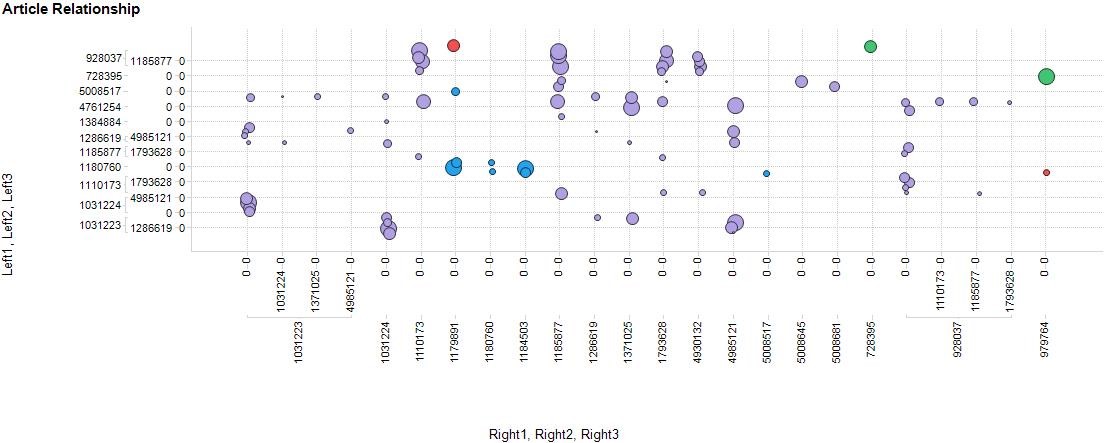
Figure 3 Snapshot of related article numbers – if the articles on the y axis are accessed it implies those on the x axis would also be of interest.
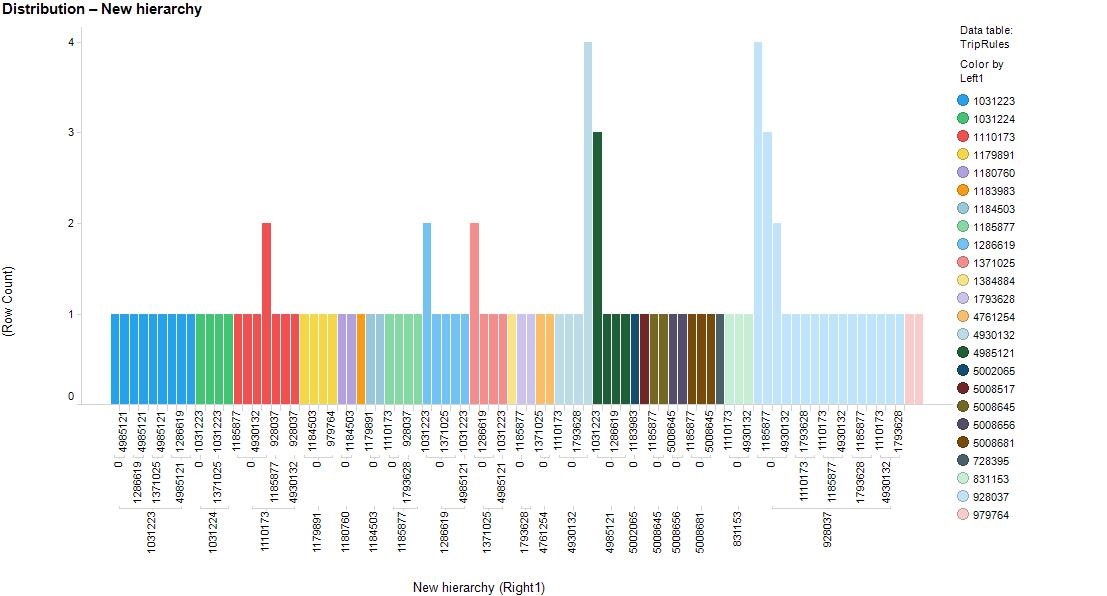
The data can be further augmented by adding clickstream data that includes the area of speciality (such as cardiology) for a user, where the for example, if you are a doctor from Spain only relationships between articles that doctors from Spain accessed could be isolated and uncovered. It was also possible to group the related articles in clusters based on this multi-dimensional relationship – defined by colour in the figure.
Figure 4 clusters of articles based on relationships
The purpose of this initial investigation was to set the stage for providing users with recommendations based on their initial article of interest and their particular user characteristic. A slightly different approach to PubMed’s ‘related articles’ feature.
As well as finding closely related articles QSPectral have helped us explore recommendations of new articles. So, if we know a user’s activity on Trip we can start to understand them and then – with QSPectral’s help – recommend new articles that should be of interest.
Article Recommendation
How will TRIP recommend articles for you?
Machine learning methods based on clustering and classification are being investigated for providing reliable recommendations.
We believe that initial article clusters should be identified using an algorithm known as k-means clustering. Each user will then be classified as being interested in articles within a cluster based on attributes such as their first choice of article and user attributes (profession, country etc.) using a method where a tree-like graph or model of decisions and their possible consequences, including chance event outcomes, resource costs, and utility is created.
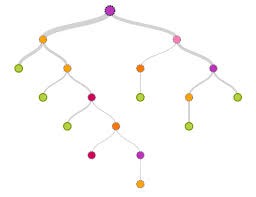
Figure 5 Example of a Decision Tree where the top node could represents you and the other nodes represent related articles based on branch criteria.
QSPectral determined that decision trees are the most appropriate concept for meeting the requirements. Decision tree methods can accommodate more data inputs over time. Various other transformations of inputs are possible and are robust to inclusion of irrelevant fields in the data, and produces transparent models for on-going analysis.
Further, we will use other methods that take a number of simple decision trees and combine them in some way to yield a final overall picture. We propose techniques for iteratively averaging multiple deep decision trees, trained on different parts of the collected data, with the goal of reducing the variance. Each iteration creates a simple decision tree on randomly selected subsets of input variables and input data. The final result where recommendations are provided will be formed through classifying a user through the aggregation of all such trees.


Recent Comments