The search safety net is a novel feature to help improve searching; helping users not miss important papers. I wanted to explain it – simply – but have failed on that score. It’s important so I hope you can make sense of what I’ve written. If you have any questions, my email is jon.brassey@tripdatabase.com.
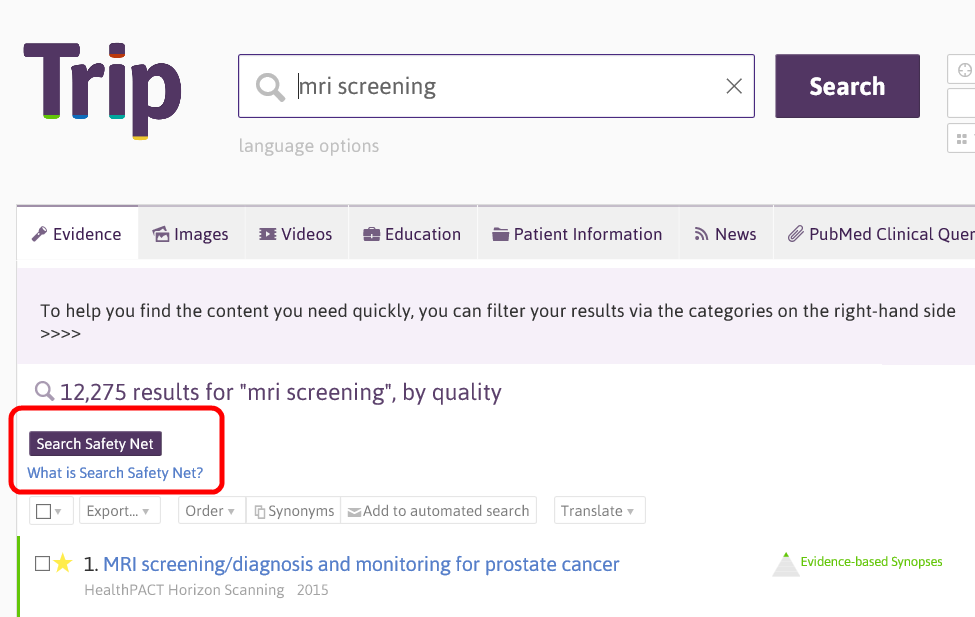
After a search you will see a new ‘Search Safety Net’ button
If you click that it’ll bring up a list of related search terms. It does this by looking at the top 250 search results and analysing the search terms people have previously used when clicking on these results. This works on the notion that a single document can be clicked on after numerous searches. For instance, in the example above search terms might have been ‘prostate cancer screening’, ‘MRI screening’ etc.
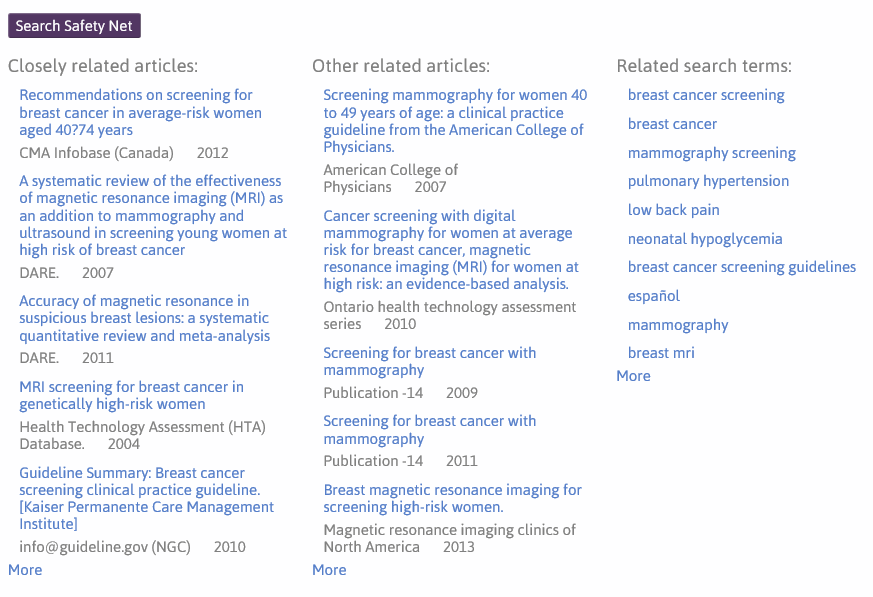
The next section of the search safety net happens AFTER you’re conducted your search and found a number of documents you like AND looked at (or simply clicked the ‘check box’ to the left of the result). If you click on the Search Safety Net button again you see three columns of results:
The first column is closely related articles, the second is other related articles and the third is the related search terms. The latter column is similar to the description of related search terms above, but is based purely on the documents clicked (as opposed to the top 250 results). However, to understand the process behind the other two columns you need to understand a clickstream data.
Paper 1 ———- Paper 2 ———- Paper 3
In the above there are three papers (1-3). A user, in the same session, clicks on Paper 1 and Paper 2, therefore we can make a link between the two. Another user might click on Paper 2 and Paper 3, again making a link. So, Paper 1 is connected to Paper 2 (a single step, using network language) while Paper 3 is two-steps away from Paper 1. We have this data for all articles in Trip.
Slightly simplifying things (!) the first column is the most popular related articles based on documents that are one step away from the documents clicked. So, we look at all the articles clicked by the user and pull back all the documents that are one step away, displaying most ‘popular’ at the top. The second column are all the documents that are two steps away. This is likely to find less focused results, but the occasional really interesting study that might have been missed.
Two important issues:
- For this to work requires clicks, if the documents you’ve looked at has no clicks, then you’ll get no results.
- This is being released as a ‘beta’ bit of software, as in we’re still developing it. At present it is available to both free and Premium users of Trip. However, this is likely to change in the near future.

Recent Comments