Our evidence mapping system is experimental/proof of concept and should be treated with scepticism. And, to be clear, this is a fully-automated system that relies on techniques such as machine learning and natural language processing (NLP). There are a list of known issues – please read!
At the simplest level the system aggregates interventions that explore the same condition and intervention – be it randomised controlled trials or systematic reviews. These are then ‘mapped’ to give a visual representation of the interventions used for a given intervention with an indication of the potential effectiveness.
The evidence for each intervention is displayed in a single evidence ‘blob’. The system assesses:
- if the intervention is effective
- is based on biased data and
- in the case of RCTs – how big the trial is.
It uses these to arrive at an estimate of effectiveness (visualised by relative position along the y-axis). Bias is demonstrated by the shade of the evidence ‘blob’.
Now, for the more complex explanation.
Identifying the condition and intervention: We use a mixture of NLP and machine learning to try to extract the condition and intervention elements for all the RCTs and SRs within Trip. At this stage we only use trials with no active comparison – so we only use trials/reviews that are against things like placebo and usual care.
Effectiveness: We use sentiment analysis to decide if the intervention is positive (favours the intervention) or negative (shows no benefit over placebo or usual care).
Sample size: Using a rules based system we identify the sample size of RCTs.
Bias: For RCTs we use RobotReviewer to assess for bias. Trials are categorised as ‘low risk of bias’ or ‘high/unknown risk of bias’. For SRs we have been pragmatic and cautious. We have counted Cochrane reviews as low risk of bias and all the rest as high/unknown.
Creating the overall score: For each trial or review we start with the score of either 1 or -1 (positive or negative). We then adjust using the sample size and bias score.
- Sample size: If the trial is large we don’t adjust on that variable, but the smaller the trial the greater the adjustment. So, a very small trial – due to inherent instability – will score very little.
- Bias: If the trial has low risk of bias we do not adjust the score further but if it has a bias score of high/unknown we reduce the score further.
So, a large, positive, trial with low risk of bias will score 1 while a very small, positive, trial with a high/unknown bias will score very little (not much more than zero).
We then combine the separate scores, depending on what trials/reviews we find:
- Only RCTs: The scores are weighted based on the sample size. If we have two trials, one with a sample size of 100 and a score of 0.20 and another trial with a sample size of 900 and a score of 0.80 we – in effective – create a score based on ((100*0.2) + (900*0.8))/1000 = 0.74
- Mix of RCTs and SRs: If there is an unbiased SR we take that as a definitive answer and use that score (irrespective of trials beforehand – we assume the SR found those). However, any trials or reviews published the same year or later are used to modify the score (as outlined in the ‘Only RCTs’ scoring system). So, an unbiased SR with a positive score will have a score of 1. If any RCTs and SRs (high/unknown risk of bias) which score negatively will bring the overall score down – depending on sample size and bias scores.
Understanding the visualisation

The size of each blob represents the sample size. The larger the blob, the bigger the combined sample size.
The colour of the blob represents how biased the content is. By that we mean the proportion deemed at low risk of bias and the proportion at high/unknown risk of bias. Light green is the lowest risk of bias.
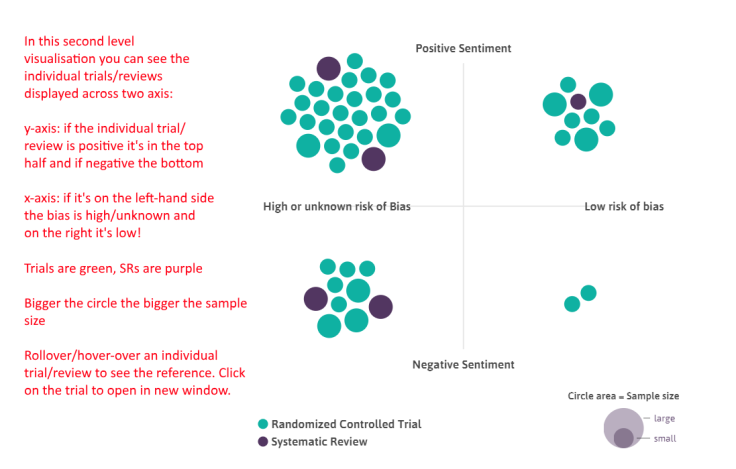
Second level visualisation
If you click on an individual blob it reveals a detailed breakdown of the constituent parts of each blob, showing the individual trials/reviews:

Reminder: even though it shows all the data we find we don’t necessarily use all of it in the scoring of each intervention. See ‘Creating the overall score’ above.
Next stage
To us, this is a proof of concept, and we feel the wider ‘evidence community’ can help guide developments. However, quality is key so we want to improve the data. Each of the automated steps is not 100% accurate (although fairly close) So, we see two immediate needs:
- Improve the underlying automation systems – we will move to this shortly.
- Allow manual editing. We need to build a system that easily allows ‘wrong’ trials/reviews to be removed and omitted ones added. Again, this is being planned and we have lots of ideas to make it work pretty smoothly. Assuming people participate we are contemplating allowing users to ‘publish’ their work and we’re talking to publishers about this.
June 10, 2018 at 6:04 pm
Very very interesting, I world like to try 👍
LikeLike
June 11, 2018 at 5:20 am
You can try it, via https://www.tripdatabase.com/autosynthesis/search
LikeLike
June 11, 2018 at 5:20 am
You can try it, via https://www.tripdatabase.com/autosynthesis/search
LikeLike